
Case study · Production
Production Dashboard for a Manufacturing Company
A confidential manufacturing company moved from end-of-day paper logs to a live, plant-wide production dashboard — providing supervisors and management with dashboard-based visibility of plan vs actual, downtime and rejection while the shift is still running.
The business challenge
Problems surfaced only after the shift had ended
Production was recorded on paper and compiled into reports the next day. By the time management saw plan-vs-actual gaps, downtime or rejection trends, the shift was over and the opportunity to react had passed.
Supervisors lacked a single live view of the floor, and management reports were assembled by hand — late, effort-intensive, and rarely in agreement with what operators had recorded.
Operational impact — before Edhaas
What the team lived with day to day
End-of-day blindness
Plan vs actual was only known after the shift ended.
Hidden downtime
Breakdowns and changeovers weren't captured, so losses stayed invisible.
Manual MIS
Management reports were compiled by hand and often late.
Late rejection signals
Scrap and rework were noticed after material was already lost.
What Edhaas built
A live production system shaped to their floor
Edhaas built production tracking and dashboards around the company's routings, machines and shift patterns.
Work-order & job tracking
Every order's quantity, stage and status tracked against plan.
Live plan vs actual
Real-time output by line, machine and shift.
Downtime & OEE capture
Breakdowns and changeovers logged to measure losses.
Rejection & rework logging
Scrap captured by reason, operation and machine.
Supervisor floor screens
Live status visible on the floor, not just in reports.
Automated management MIS
Reports generated automatically instead of by hand.
Workflow covered
From work order to MIS — tracked live
- 1Work Order
- 2Job Scheduling
- 3Shop-Floor Execution
- 4Production Logging
- 5Downtime & Rejection
- 6Live Dashboards
- 7MIS Reporting
Key features
What the system does
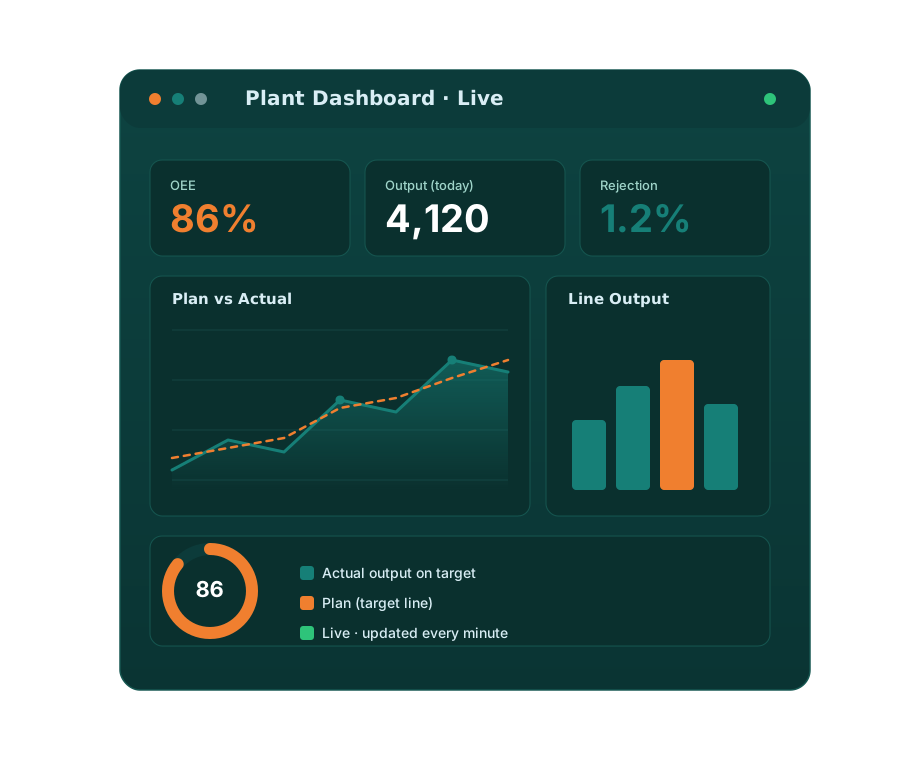
Real-time dashboards
Plan vs actual and losses, updated as work happens.
OEE breakdown
Availability, performance and quality in one view.
Downtime reasons
Structured capture of stoppage causes.
Shift & machine views
Compare output across machines, lines and shifts.
Mobile / large-screen ready
Usable on the floor and on management devices.
Automated reports
Scheduled MIS without manual compilation.
Business outcomes
What changed after go-live
Outcomes are described qualitatively. Specific figures are kept confidential at the client's request.
Real-time visibility
Plan vs actual seen during the shift, not the next morning.
Faster response
Downtime and rejection surfaced in time to act.
Reliable MIS
Management reporting generated automatically from floor data.
Improved visibility for dispatch planning
Live order tracking helped the team monitor dispatch commitments more closely.
Inside the system
What the software looks like
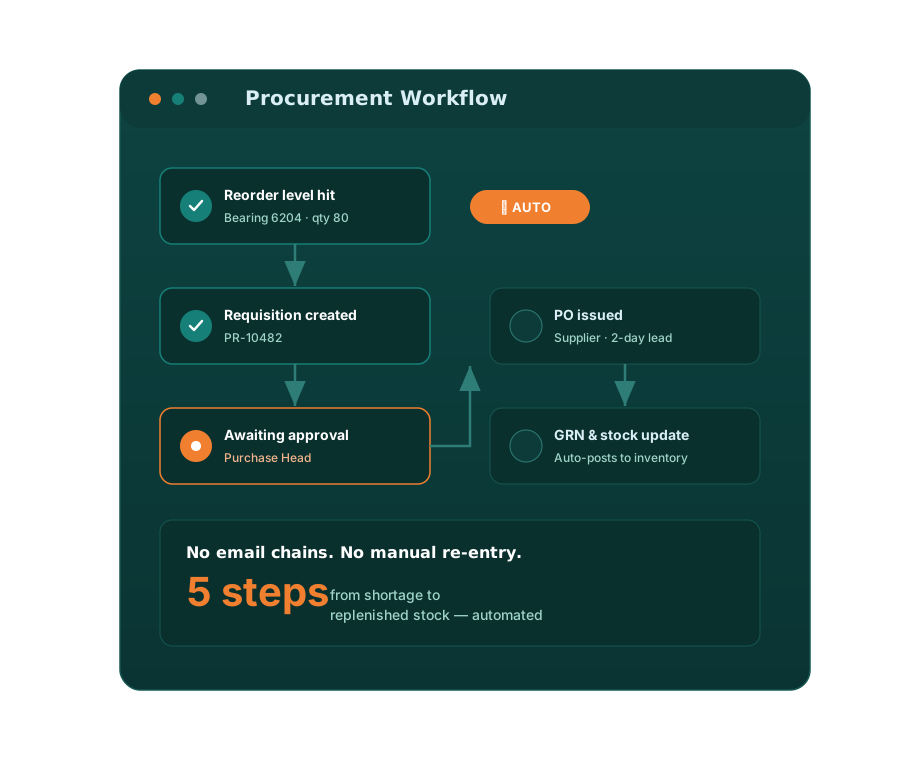
Representative interfaces from this type of build. Actual client screens are confidential.
Related solutions
Software behind this case study
Questions
About this production dashboard project
Want better production visibility during the shift?
Tell us how you track output today and where it leaks — we'll show you a live production system built around your floor.